















CHAPTER 01 / BEFORE YOU BEGIN
Prepare your materials. Define the deliverables.
Developers and marketing teams who need to assess slow pages or problematic mobile experiences.
Starting materials
- Priority pages and templates
- PageSpeed Insights or Search Console data when available
- History of changes to scripts, images, and templates
What you will prepare
Performance baseline, hypothesis list, and improvement sequence.
Use it as material for decisions and discussions, then adjust the work limits to your conditions.
Starting from one page, one process, or one most important need. Note unknowns as questions; Don't force answers just to make the worksheet look finished.
CHAPTER 02 / WORK STEPS
Work in a clear order.
Select the page and viewing conditions
Use examples of service, detail, form, and campaign landing pages that really matter. Separate mobile and desktop; note the date, device, and data source. Field data depicts real users who meet the scope of the source, while laboratory tests help diagnose specific conditions. Don't assume one test is representative of all visits.
Read metrics according to their function
LCP corresponds to the largest display of content, INP to interaction response, and CLS to positional stability. The threshold for the good category is LCP ≤2.5 seconds, INP ≤200 milliseconds, and CLS ≤0.1 at the 75th percentile. The threshold is a reference for evaluation, not a promise of project results or a substitute for observing user tasks.
Connect observed issues to possible technical causes
Bad LCP can be related to the main image, server response, or rendering delays. INP requires JavaScript job checking during interaction. CLS can emerge from media with no fixed space or late incoming elements. Check the evidence in the tooling before changing many things at once; The source of the problem is not always the same between pages.
Check for improvements and side effects
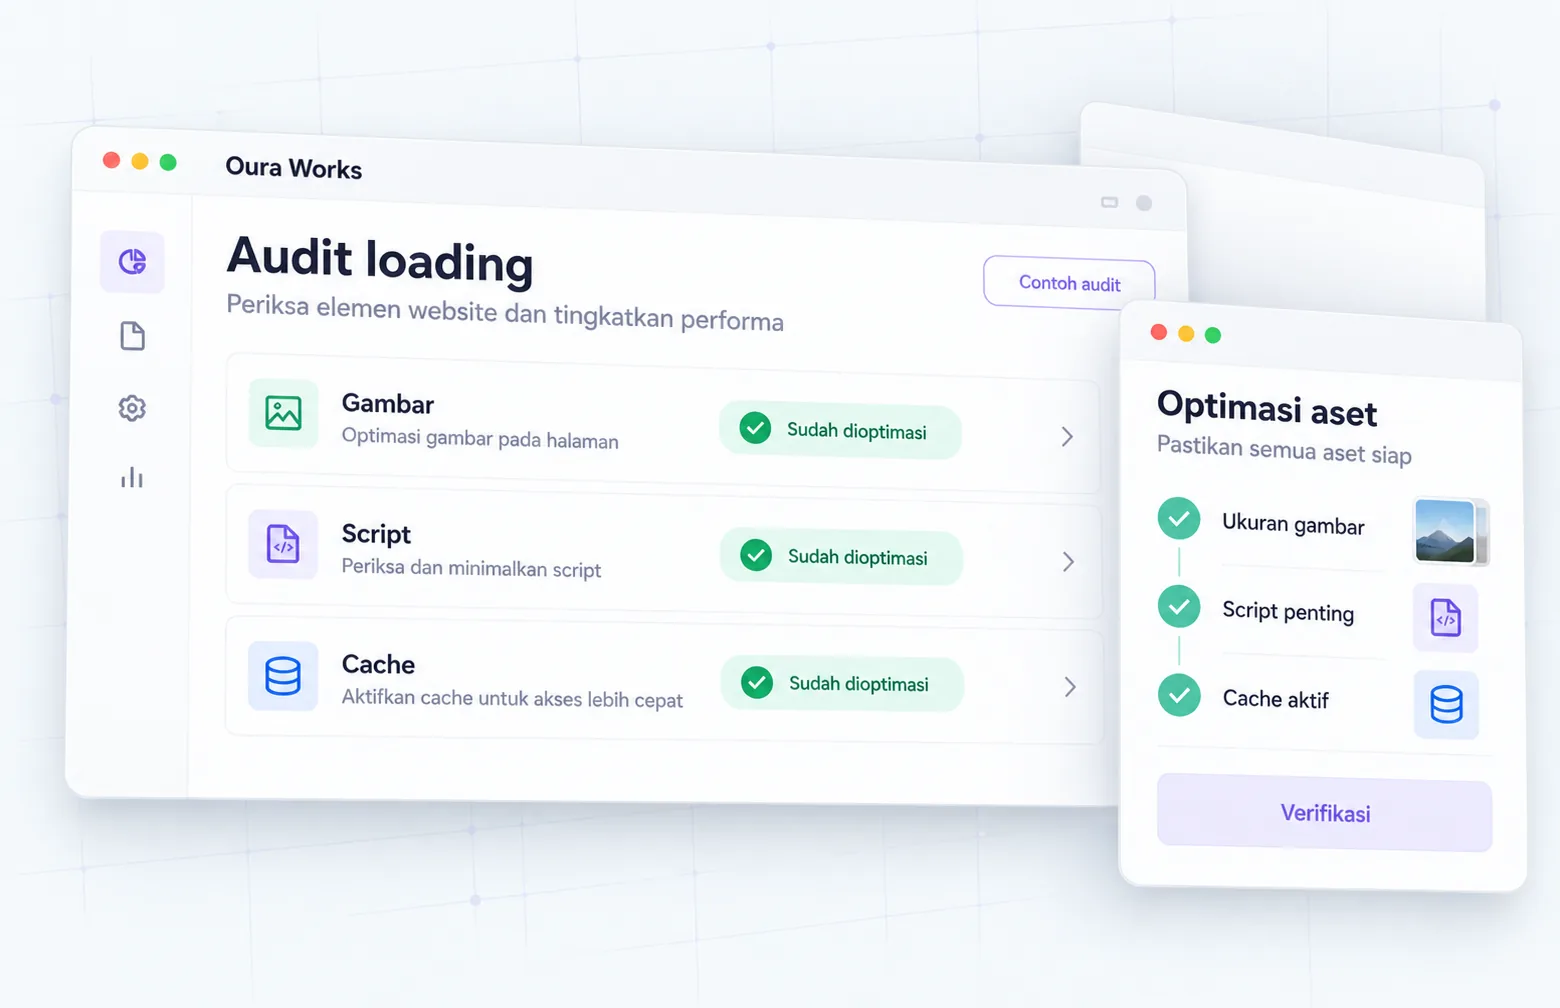
Starting from changes that have a big impact and the risks can be controlled. Retest under comparable conditions, then check forms, analytics, and key elements. Script reduction should not break important functions. Field data takes time to reflect changes; note the release date for correct interpretation.
CHAPTER 03 / EXAMPLE SURGERY
Connect steps to real decisions.
The diagnosis example below is a practice hypothesis, not a client's measurement results. Any conjecture must be confirmed before it is implemented.
| Symptoms | Checked allegations | How to evaluate |
|---|---|---|
| The main image is late | Size, format, load priority | Compare loading timelines |
| Buttons feel slow | JavaScript jobs during interaction | Check recorded interactions |
| Content shifts | Late media/element size | Observe the shift layout source |
| Broken form after optimization | Important scripts are also delayed | Test the entire form path |
Replace the example lines with your business conditions. Mark information that already has evidence, that is still an assumption, and that needs to be asked of the person in charge.
CHAPTER 04 / REVIEW POINT
Avoid decisions that seem right, but have not been tested.
Chasing a score of 100 as the only goal
Prioritize experience over real tasks and relevant metrics.
Change all plugins at once
Gradual changes facilitate diagnosis as well as recovery if function is impaired.
If a decision impacts costs, access, data, or other teams' work, list the parties who need to approve it. Explain the evidence that is available and the extent of information that remains to be examined.
CHAPTER 05 / WORKBOOK
Make your plans here.
Fill in concisely and specifically. For information that is not yet available, write who needs to be asked for confirmation. These notes are not sent by the Playbook feature to Oura; download before the tab closes.
Do not enter passwords, access tokens, or personal customer data. Temporary storage follows the browser tab session, not the Oura account.
CHAPTER 06 / BEFORE SUBMISSION
Check your job readiness.
This checklist records the tasks you marked. It is not an audit score, certification, or automatic assessment of a website.
Frequently asked questions
Why hasn't the field data changed?
Data sources have a specific observation window and scope. Note the release date and data period.
What if field data is not available?
Use controlled testing for diagnosis while explaining its limitations; do not fabricate real user results.
Referral & usage limits
References checked on October 2, 2026. Steps, examples and worksheets are Oura editorial formulation with the help of AI and public references. Examples are not client results. The guide does not guarantee business results and does not replace a dedicated examination of your systems.